
How to read a Weather Map in 4 steps
STEP 1
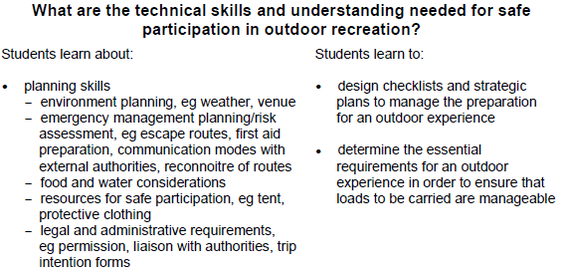
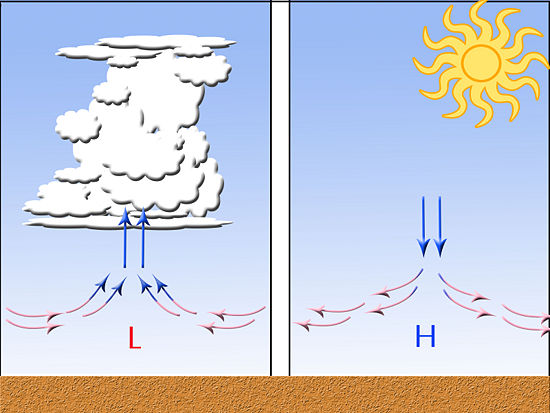
Understand general concepts of the weather. What most people are concerned with is precipitation, which, in meteorology (the study of weather), is any form of water that falls onto the Earth's surface. Forms of precipitation include rain, hail, snow, and sleet. Generally, high pressure implies fair weather and low pressure is usually associated with precipitation.
Understand general concepts of the weather. What most people are concerned with is precipitation, which, in meteorology (the study of weather), is any form of water that falls onto the Earth's surface. Forms of precipitation include rain, hail, snow, and sleet. Generally, high pressure implies fair weather and low pressure is usually associated with precipitation.
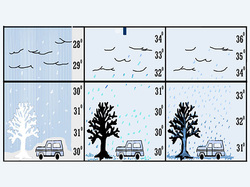
STEP 2Find a weather map. Watch out for one on the TV news, online,
or in your local newspaper. (Other sources may include magazines and books, but they may not be current.) Newspapers are a convenient method to find a weather map, as it is cheap, reliable, and can be cut apart so that you can carry it with you while learning to interpret the symbols. To the right is a synoptic chart of Australia dated 16/8/13 www.weatherzone.com.au/synoptic.jsp?d=0 . |
|
STEP 3
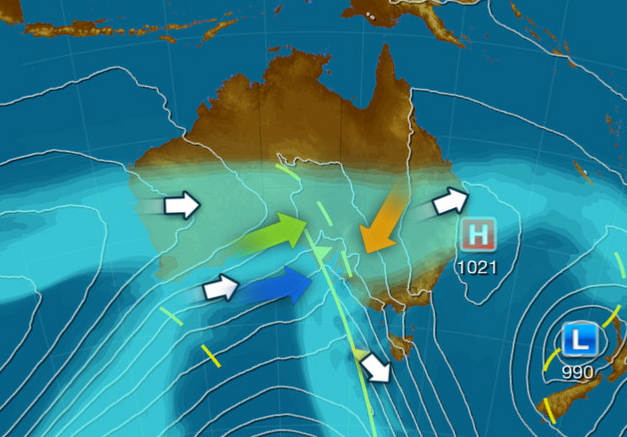
Read the air pressure. This is the weight or pressure the air exerts on the ground and is measured in millibars. It’s important to be able to read air pressure because pressure systems are associated with certain weather patterns. To read air pressure, check for isobars (iso = equal, bar = pressure) – plain, curved lines that indicate areas of equal air pressure. Isobars play a major role in determining the speed and direction of wind. When the isobars form concentric closed (but not always round) circles, the smallest circle in the center indicates a pressure center. This can be either a high pressure system (depicted by an "H" in English,) or a low pressure system (depicted by an "L" in English,). Air does not flow "down" pressure gradients; it flows "around" them due to the Coriolis effect (Earth spinning). Hence, wind direction is indicated by the isobars, clockwise around lows (cyclonic flow) and anti-clockwise around highs (anticyclonic) in the northern hemisphere, thus creating wind. The closer the isobars are to one another, the stronger the winds.
Read the air pressure. This is the weight or pressure the air exerts on the ground and is measured in millibars. It’s important to be able to read air pressure because pressure systems are associated with certain weather patterns. To read air pressure, check for isobars (iso = equal, bar = pressure) – plain, curved lines that indicate areas of equal air pressure. Isobars play a major role in determining the speed and direction of wind. When the isobars form concentric closed (but not always round) circles, the smallest circle in the center indicates a pressure center. This can be either a high pressure system (depicted by an "H" in English,) or a low pressure system (depicted by an "L" in English,). Air does not flow "down" pressure gradients; it flows "around" them due to the Coriolis effect (Earth spinning). Hence, wind direction is indicated by the isobars, clockwise around lows (cyclonic flow) and anti-clockwise around highs (anticyclonic) in the northern hemisphere, thus creating wind. The closer the isobars are to one another, the stronger the winds.
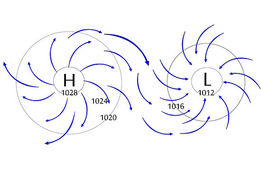
HIGHS & LOWSLow Pressure System (Cyclone): Increased cloudiness, winds,
temperatures, and chance of precipitation. Represented on a weather map by isobars that are very close together, arrows traveling clockwise (Southern Hemisphere) or counter-clockwise (Northern Hemisphere), usually with a "T" in the middle isobar, which forms a round circle (the letter can vary, however, depending on the language the weather report is presented in). It can also be shown through radar imagery. Tropical cyclones (South Pacific) are also named hurricanes around America or typhoons in coastal Asia. High Pressure System: Indicates clear, calm conditions with reduced chance of precipitation. Drier air usually results in a greater range of high and low temperatures. Represented on a weather map as isobars with an "H" in the middle isobar and arrows showing which direction the wind is flowing (clockwise in Northern Hemisphere, counter-clockwise in the Southern Hemisphere). Like cyclones, they can also be shown with radar imagery. |
|
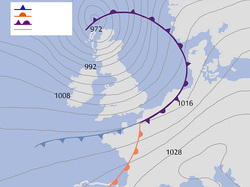
Its path can be distorted by mountains and large bodies of water. On a weather map, you will notice some lines that have semi-circles or triangles on either side, or both (shown here). These indicate the boundaries for various types of
fronts:
front is moving.
the warm air mass is unstable, the weather might be characterized by prolonged thunderstorms. Represented on a weather map by (red) lines with semi-circles on
one side. The side that the semi-circles are on represent the direction in which the warm front is heading.
on whether it is a warm or cold occlusion. The passing of an occluded front usually brings drier air (lowered dew point). Represented on a weather map by a
(purple) line with semi-circles and triangles both on the same side. Whichever side they're on is the direction the occluded front is going.
Stationary front: Indicates a non-moving boundary between two different air masses. Long continuous rainy periods that linger for extended
periods of time in one area and move in waves. Represented on a weather map by a line with semi-circles bordering one side and triangles along the opposite side, indicating that the front is not moving in any direction.